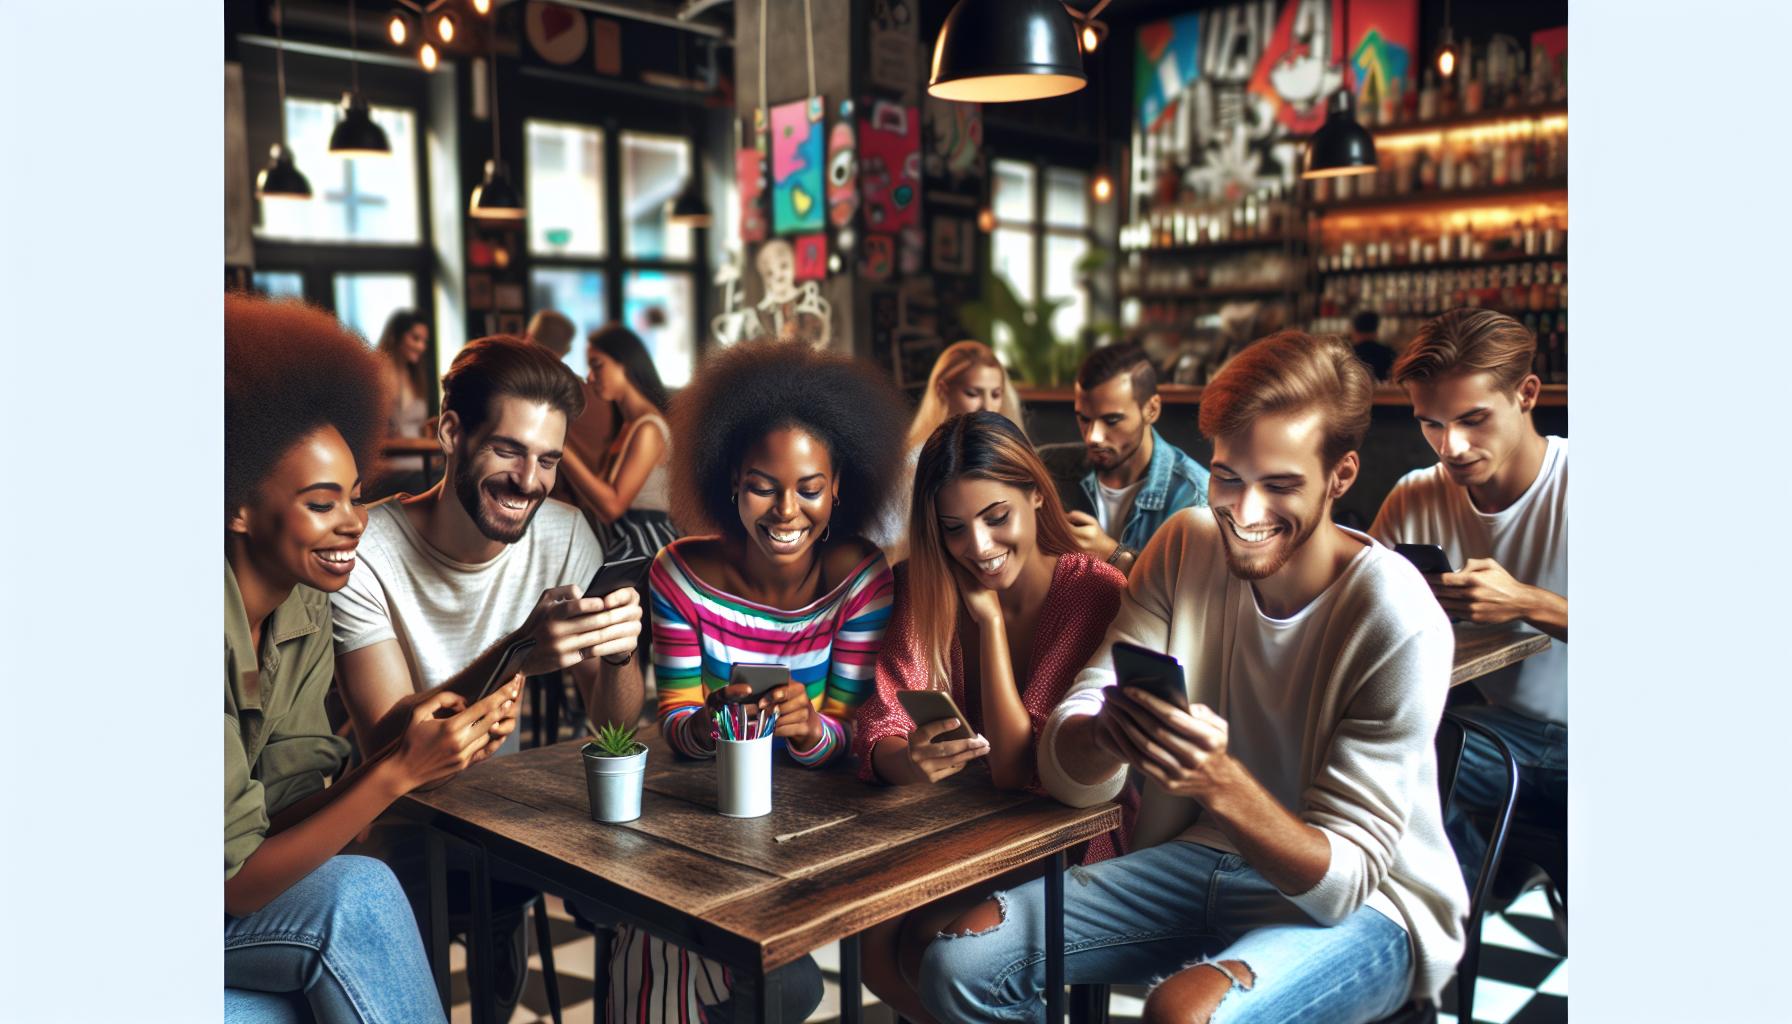
Social media engagement has become the holy grail of digital marketing success. In today's fast-paced online world brands aren't just competing for attention – they're fighting for likes shares and meaningful interactions. It's no longer enough to simply post content and hope for the best.
The digital landscape has evolved beyond basic metrics like follower counts. Modern social media success hinges on creating genuine connections with audiences through strategic engagement tactics. From Instagram's double-taps to Twitter's retweets every interaction counts in building a brand's online presence and community. Smart businesses know that higher engagement rates directly correlate with increased brand loyalty customer retention and ultimately revenue growth.
Social Media Engagements
Social media engagements encompass every interaction users have with content across social platforms. These interactions include likes, comments, shares, saves, clicks, mentions, direct messages, reactions and poll responses.
Key engagement metrics fall into three categories:
- Reactions: Likes, hearts, emojis, upvotes
- Interactions: Comments, replies, mentions, DMs, poll participation
- Amplification: Shares, retweets, reposts, saves, bookmarks
Each platform tracks engagements differently:
| Platform | Primary Engagement Types |
|---|---|
| Likes, Comments, Saves, Shares to Stories | |
| Reactions, Comments, Shares, Clicks | |
| Likes, Replies, Retweets, Quote Tweets | |
| Reactions, Comments, Shares, Clicks | |
| TikTok | Likes, Comments, Shares, Saves |
Engagement actions signal different levels of audience connection:
- Surface-level: Quick reactions like likes or emoji responses
- Mid-level: Comments and replies showing active participation
- Deep-level: Shares and saves indicating strong content value
Platform algorithms measure these engagement signals to determine content reach and visibility. Higher engagement rates typically lead to increased organic distribution through platform feeds and discovery features.
- Visual platforms (Instagram, TikTok): Saves carry more weight
- Professional networks (LinkedIn): Comments demonstrate expertise
- News-focused (Twitter): Retweets amplify message reach
- Community-based (Facebook): Comment threads build discussions
Key Metrics That Matter

Social media engagement metrics reveal how audiences interact with brand content across different platforms. Understanding these metrics enables data-driven decisions for content strategy optimization.
Likes and Reactions
Likes represent the most basic form of social media engagement, indicating content resonance with audiences. Facebook offers 6 reaction options: Like, Love, Haha, Wow, Sad, and Angry. Instagram displays standard likes through heart icons, while LinkedIn provides 5 reaction choices: Like, Celebrate, Support, Love, and Insightful. These quick-action metrics help gauge immediate content appeal by measuring audience sentiment without requiring significant user effort.
Comments and Replies
Comments demonstrate deeper engagement than likes, showing active audience participation in conversations. Users express opinions, ask questions, or share experiences through comments, creating two-way communication channels. Platform algorithms prioritize content with high comment volumes due to increased dwell time and user interaction. Comments provide qualitative feedback about content effectiveness, brand perception and audience interests, making them valuable metrics for community management.
Shares and Retweets
Shares amplify content reach by extending visibility beyond the original follower base. Twitter retweets, Facebook shares and LinkedIn reposts indicate strong content endorsement as users associate their personal brand with shared material. Content sharing generates 3x more engagement than standard reactions, making it a prime indicator of resonance. Tracking share metrics reveals which content types inspire audience advocacy and deserve increased promotional focus.
Best Times to Post for Maximum Engagement

Optimal posting times significantly impact social media engagement rates across platforms. Strategic timing enhances content visibility leading to increased interactions from target audiences.
Platform-Specific Timing
LinkedIn sees peak engagement on weekdays between 10 AM – 12 PM EST, with Tuesday through Thursday generating 3x higher interaction rates. Instagram posts perform best from 11 AM – 2 PM Monday through Friday, reaching 87% more users than off-peak hours. Facebook engagement spikes between 1 PM – 3 PM on weekdays, particularly on Wednesdays at 2 PM which sees 30% higher click-through rates. Twitter maintains consistent activity from 9 AM – 4 PM on weekdays, with tweets posted at 10 AM receiving 89% more engagement than other times. TikTok users engage most actively from 7 PM – 11 PM daily, with peak activity occurring between 9 PM – 10 PM resulting in 2x higher completion rates.
Audience Time Zone Considerations
Social media audiences spread across multiple time zones require strategic posting schedules. Global brands optimize engagement by staggering content release times based on regional peak activity periods. European audiences engage most actively between 9 AM – 11 AM CET while Asia-Pacific users show highest activity from 7 PM – 9 PM SGT. Major US time zones display distinct engagement patterns: EST peaks at 12 PM – 2 PM PST sees maximum activity from 4 PM – 6 PM. Multi-region companies maintain engagement calendars aligned with local time zones resulting in 45% higher interaction rates. Analytics tools track timezone-specific performance metrics enabling data-driven scheduling decisions.
Creating Engaging Social Media Content

Effective social media content combines strategic planning with creative execution to drive meaningful engagement. The following components form the foundation of high-performing social media content.
Visual Content Strategy
High-quality visuals attract 94% more views than text-only posts across social platforms. Images with people generate 38% more engagement than those without. Brand posts featuring custom graphics receive 65% higher engagement rates compared to stock photos. Video content earns 48% more views than static images, with short-form videos under 60 seconds generating the highest completion rates. Infographics drive 3x more shares than other visual content types while reducing complex information into digestible formats. Color psychology plays a significant role, with branded colors increasing recognition by 80% across social feeds.
Interactive Elements
Polls generate 91% higher engagement rates than standard posts by prompting direct user participation. Question posts receive 5x more comments than declarative statements. Quizzes achieve 96% completion rates when designed with audience interests in mind. User-generated content campaigns increase engagement by 28% through authentic community participation. Instagram Stories with interactive stickers like sliders or emoji reactions see 83% higher completion rates. Live streams featuring Q&A segments maintain viewer retention 10x longer than pre-recorded content. Interactive carousels earn 1.4x more saves than single-image posts by encouraging swipe-through actions.
Measuring Engagement Success
Social media engagement metrics provide crucial insights into content performance. These measurements reveal audience behaviors patterns enabling data-driven optimization of social media strategies.
Analytics Tools and Reports
Social media analytics tools transform raw engagement data into actionable insights. Facebook Analytics tracks user interactions with detailed demographic breakdowns including age gender location. Twitter Analytics measures impression rates reply counts retweet ratios. Instagram Insights displays reach story views saves engagement rates per post type. Google Analytics integrates with social platforms to monitor traffic referrals conversion rates ROI metrics. Third-party tools like Hootsuite Sprout Social Buffer analyze cross-platform performance with unified dashboards customizable reports automated scheduling features.
| Platform | Key Metrics Tracked |
|---|---|
| Reach, CTR, Demographics | |
| Story Views, Saves, Profile Visits | |
| Impressions, Link Clicks, Mentions | |
| Page Views, CTR, Engagement Rate |
Setting Benchmarks
Industry benchmarks establish performance standards across social platforms. Instagram average engagement rates range from 1% to 5% depending on follower count. Facebook pages achieve 0.09% engagement rates for organic posts. Twitter engagement averages 0.045% across industries. LinkedIn company pages maintain 2-3% engagement rates.
| Industry | Average Engagement Rate |
|---|---|
| Retail | 0.68% |
| Media | 1.45% |
| Tech | 1.55% |
| Fashion | 1.16% |
- Maintaining consistent posting schedules
- Creating platform-specific content
- Responding to comments within 60 minutes
- Testing different content formats
- Analyzing competitor performance metrics
Building an Engaged Community
Strong social media communities form through consistent engagement strategies that prioritize authentic interactions. Active community members generate 5x more user-generated content than passive followers, creating a self-sustaining engagement ecosystem.
Fostering Meaningful Conversations
Asking open-ended questions encourages members to share experiences, generating 3x more responses than closed-ended queries. Branded hashtags increase community participation by 42%, enabling members to find related discussions easily. Regular live Q&A sessions boost member engagement rates by 86%, creating real-time connection opportunities.
Creating Exclusive Community Content
Members-only content drives 67% higher engagement rates compared to public posts. Exclusive features include:
- Behind-the-scenes glimpses of company operations
- Early access to product launches or updates
- Special community challenges or competitions
- Member spotlight features highlighting active participants
- Private polls determining future content direction
Establishing Community Guidelines
Clear community guidelines increase positive interactions by 73%. Essential elements include:
- Response time expectations for member queries
- Content sharing protocols within the community
- Behavior standards for constructive discussions
- Conflict resolution procedures
- Privacy protection measures
Empowering Community Leaders
Designated community ambassadors increase engagement by 58%. Active community leaders:
- Monitor discussions to maintain quality
- Welcome new members personally
- Initiate engaging conversation threads
- Recognize outstanding community contributions
- Bridge communication between brands and members
This structured approach to community building creates sustainable engagement patterns, with established communities showing 34% higher retention rates than non-community focused social media presences.
Content Creation and Community
Social media engagement stands as a cornerstone of modern digital marketing success. The multifaceted nature of engagement metrics from basic likes to meaningful conversations shapes how brands connect with their audiences across platforms. Effective engagement strategies that combine optimal posting times targeted content creation and community building lead to sustainable growth and enhanced brand loyalty.
Through consistent measurement analysis and adaptation brands can build thriving online communities that generate lasting value. Success in social media engagement isn't just about following trends – it's about creating authentic connections that resonate with audiences and drive meaningful interactions. By implementing these proven strategies brands can transform their social media presence from a one-way broadcast channel into a dynamic engagement hub.

